Snapshot
The MSCI All Country World Index climbed 4.4% in US dollar (USD) terms over the month, as easing geopolitical risks, hopes that the US will secure trade deals ahead of the 9 July tariff deadline and optimism that the US Federal Reserve (Fed) could reduce interest rates in the coming months lifted sentiment. The US and China also finalised a trade framework, and the White House stated that it had imminent plans to reach agreements with several major trading partners. Developments in the Middle East had a minimal impact on markets as investors viewed the ongoing Israel-Iran conflict as likely short-lived. Israel established air superiority within a day, neutralising Iran’s much-touted projectile response. Subsequently, Israel was free to target locations within Iran. The US soon joined the conflict, targeting Iranian nuclear sites with Massive Ordnance Penetrator strikes. A ceasefire between Israel and Iran was reached soon after. Technology stocks (which did well again in June) have grabbed the limelight recently, but we find that there is another sector that deserves a closer look. Hint: this section is not typically considered “sexy”.
Within fixed income, the US Treasury (UST) yield curve shifted lower in June, with front-end yields outperforming. Yields initially rose following a stronger-than-expected US jobs report, with non-farm payrolls increasing by 139,000. The European Central Bank (ECB) delivered a widely-anticipated rate cut in early June but signalled a possible pause—if not an end—to its easing cycle. Escalating tensions between Israel and Iran did fuel risk-off sentiment and a flight to safety. The Fed held rates steady, as expected, and maintained a cautious, data-dependent stance. During his semi-annual testimony, Fed Chairman Jerome Powell pushed back against expectations for a July cut. However, yields continued to decline, driven by dovish remarks from Fed Governors Christopher Waller and Michelle Bowman in support of a July rate cut, falling oil prices following the Iran-Israel truce and downward GDP revisions reflecting softer consumer spending. By the end of June, the benchmark 2-year and 10-year UST yields settled at 3.72% and 4.23%, respectively, 18 basis points (bps) and 17 bps lower compared to end-May.
Outside of general equity and fixed income markets, gold prices rose 0.4% in June amid geopolitical and trade tensions, as well as increased optimism that the Fed is preparing to resume monetary easing. A weaker dollar also lent support to gold prices. The US currency saw its worst start to a year in more than half a century, with the dollar index (DXY) down nearly 11% for the first half of the year. West Texas Intermediate crude oil prices jumped 7.1%, but not without sharp price swings over the month. Prices initially surged after the flare-up of tensions in the Middle East and US airstrikes on Iranian nuclear sites, but they retreated after a ceasefire between Iran and Israel eased fears of global oil supply disruptions. Real estate, as measured by the FTSE NAREIT Global Real Estate Index, edged up 0.4%.
Cross-asset1
For the month of June, we maintained our overweight to growth assets while reducing our defensives marginally. We remain confident that growth assets will continue to do well through the rest of the year, despite the prevailing uncertainties surrounding import tariffs. Market consensus for corporate earnings in the coming quarter has been revised lower since the last reporting season, setting a low bar for companies to surpass. However, we are mindful of any corporate guidance regarding the delayed impact of tariffs that might affect our investment view. Our overweight stance is currently based on our view that news flow will become more positive, with a number of trade deals likely to be announced over the coming weeks. The recent tax bill passage is also positive for consumption and corporate profits and should stimulate further investments in the US. Outside of the US, we still view the rate-cutting cycle favourably, and this could help offset some of the slower economic growth that we are seeing. For defensive assets, we downgraded our score again in June, bringing the allocation back to neutral. US economic data continued to outperform market expectations, and this could potentially lead to upward pressure on interest rates in the near term.
Within growth assets, we maintained our overweight in developed market (DM) equities and emerging market (EM) equities. Within DM, we kept our overweight in the US on the back of better visibility on earnings growth and likely Fed cuts in the second half of the year. As a result we maintained our underweight on the UK and Australia. We kept our neutral position in Japan on expectations of the yen weakening on the Bank of Japan (BOJ)’s shift to a less hawkish tone. The longer-term structural story of improving corporate governance and earnings growth momentum in Japan remains intact. Likewise, we maintained our neutral position on Europe with the expectations that the region’s corporate earnings should turn positive in the latter half of the year with the European Central Bank (ECB) cutting rates more aggressively than the Fed. This should help to reflate the region and kickstart its economy. We continue to like Singapore for its attractive dividend yields and resilient economy. Within EM, we continue to favour selective countries—like India—which are expected to benefit from domestically-driven economies and structural long-term growth stories. Likewise, we retained our overweight position in Taiwan, which is a beneficiary of the current global tech upcycle. We maintained our neutral position in commodity-linked equities given their attractive valuation and for diversification purposes. The asset class continues to generate strong free cash flow and has good dividend yields. We maintained our underweights in REITs and infrastructure, as we see better risk rewards in other asset classes.
For defensives, we upgraded our score to gold and decreased our scores on DM sovereign bonds and investment grade (IG) credit. The increase in the score of gold is not due to a shift in our view; rather, it reflects a recent update to our Strategic Asset Allocation. We dropped our allocation to gold substantially, and our portfolios no longer hold underweights as a result. On the DM sovereigns side, we continue to see strong data coming from the US, and the market’s risk-on sentiment is pushing out Fed rate cut expectations. Hence, while the carry in the bond market is now much better than it was six to 12 months ago, the direction of yields remains volatile, shifting on a monthly basis. Within IG credit, we downgraded our score marginally to reflect the compression in spreads, with the widening from the “Liberation Day” tariffs now completely reversed. We expect credit to perform well over the short term due to strong economic conditions; however, given how tight IG spreads have become, there is less ability for spread compression to occur. In other segments of the market, we remain overweight in high yield, as spreads are not as tight as they appear at a first glance (as discussed in more detail below). For EM sovereigns, we retain a slight underweight but are approaching a neutral position. EM typically benefits from dollar weakness, and we seek to slowly allocate back into these exposures.
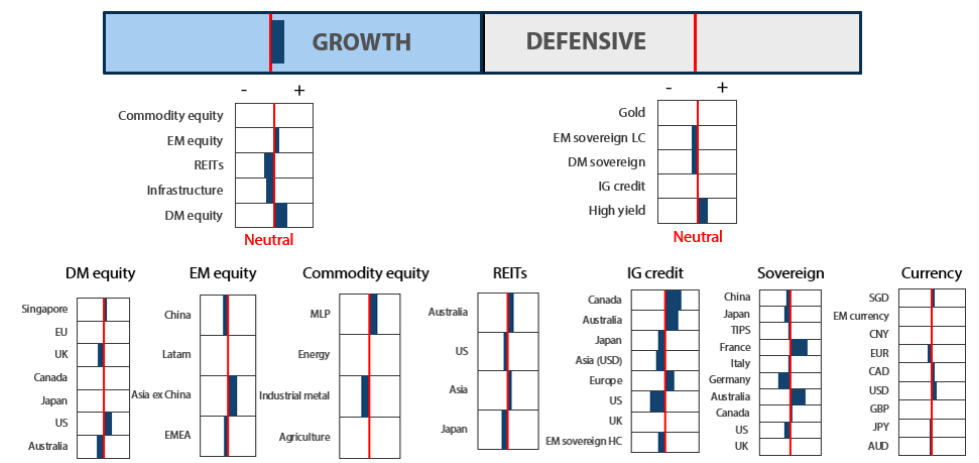
Asset Class Hierarchy (Team View2)
Research views
Growth assets
Growth assets remain appealing, as we believe that global economic growth will stay resilient despite the ongoing uncertainties due to the status of the US import tariffs, which are currently under review by the US Supreme Court. Market sentiment is gradually improving as trade deals are being discussed, with agreements potentially reached in the coming weeks. While there have been indications of softening US economic data, the economy has not collapsed as initially feared. Inflation remains benign globally, providing room for central banks to implement supportive measures to bolster economic growth. Corporate profits in the US have been resilient so far, while earnings outside of the US have been softer than expected as the global economy slows.
Overall, earnings growth remains on an upward trajectory, providing support for growth assets. However, uncertainties persist due to ongoing trade tariffs discussions and legal challenges to the Trump administration. Clarity may emerge over the next few months as these uncertainties are resolved. In the short term, we note that the passing of the tax bill is positive and should help to boost consumption and corporate profits, and any Fed rate cuts in the second half of the year should also be supportive of continued economic activities in the US.
Investing beyond the technology sector
Much has been written and debated on the technology sector, with a particular focus on its secular earnings growth and the recent scrutiny over the returns generated from investments in artificial intelligence (AI) and data centres by the major tech companies. Corporate earnings in the sector had been stellar since the Global Financial Crisis (GFC) and have significantly contributed to the earnings growth of the S&P Index over the past decade. The sector has returned an annualised performance of 19% in the past five years.
Amidst all the hype surrounding the technology sector, there are other sectors that may have been overlooked but offer promising opportunities. When we compare the various sectors of the MSCI AC World Index over the past five years, the financials sector emerges as the next best performer, delivering a surprising annualised return of 16% (see Chart 1). Financials, often seen as a traditional value sector, may not have the same appeal of growth sectors such as communications or technology. Yet it has outperformed many other sectors over the period.
Chart 1: MSCI AC World Financials performance against other sectors
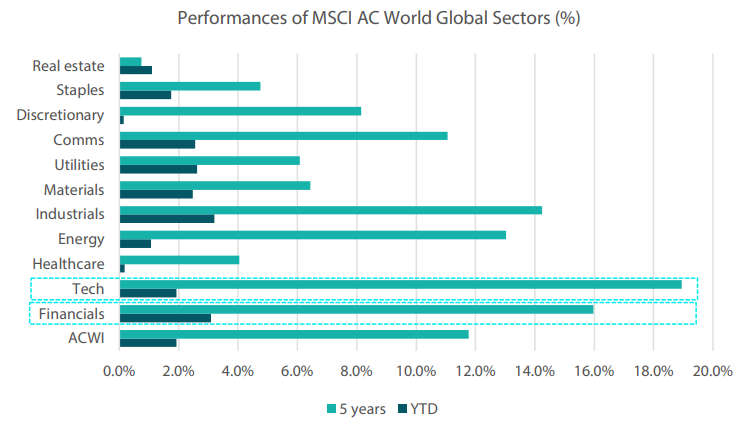
Source: Bloomberg, July 2025
Upon assessing the performance of the financials sector over the period, we found that one of reasons for its outperformance relative to the other sectors is its value-oriented nature. In 2022, the sector experienced smaller drawdowns compared to other growth sectors such as technology and communications. This can be attributed to the financials sector’s less demanding valuations. Growth sectors tend to command higher valuations and are punished harder in a risk-off environment. Growth sectors are also more sensitive to changes in the interest rate environment due to their back-loaded cashflows, resulting in lower intrinsic values when interest rates rise.
Contrary to its growth sector peers, financials usually perform better in a higher interest rate environment. As interest rate rose on the back of inflation amid resilient economic activities during the period, banks were able to increase their asset yields. This was achieved by increasing loan rates at a faster pace than deposit costs, resulting in the initial expansion of net interest margins (NIM). Consequently, the sector has seen its earnings improve. However, as depositors demand higher returns and deposit costs start to rise, NIMs will contract over time. By examining the top three regional US banks in Chart 2 below, we observe how their NIMs increased as the Fed raised interest rates through 2016–2019 and 2022–2024. As we have been in a “higher for longer” environment since 2022, banks have been able to enjoy strong earnings growth through this period.
Chart 2: Higher interest rates have lifted the NIMs of top three US regional banks
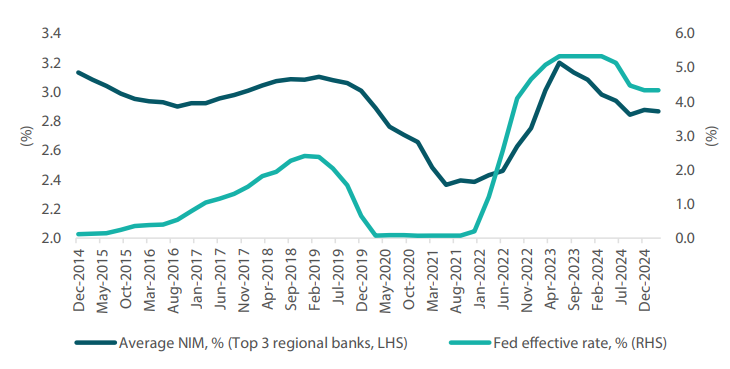
Source: Bloomberg, July 2025
The financials sector is also one of the key beneficiaries of US President Donald Trump’s victory, driven by expectations of deregulation, corporate tax cuts and a rebound in capital markets activity. The sector has been actively redistributing capital to shareholders via dividends and buybacks (See Chart 3), representing about 40–60% of earnings. With Trump’s win, US regulators have loosened capital rules—particularly those concerning the supplementary leverage ratio— enabling banks to increase their capital return. This move is expected to be well-received by investors. With the economy holding up better than expected and capital returns increasing, we expect the sector to continue performing well in the near term.
Chart 3: US financials’ capital returns to shareholders poised to increase
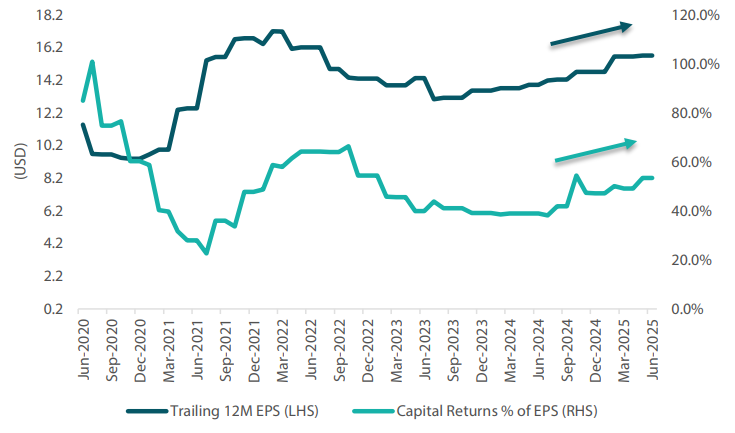
Source: Bloomberg, July 2025
Conviction views on growth assets
- Maintain overweight exposure to US growth for now: We continue to like the US for its secular long-term earnings growth driven by technology and healthcare innovations. We are also positive on increasing energy demand from data centres with the significant AI capex outlay over the next few years. There remains potential for positive surprises in the market, such as responses from central banks and import tariffs relief.
- Overweight on Singapore: We still have an overweight position in Singapore due to its defensive attributes. Singapore offers high dividend yields and low beta. The market is also strong in terms of relative valuation metrics and are least likely to be targeted by Trump’s tariffs policies, given Singapore’s trade balance deficit position.
- Maintain our overweight exposure to EMs: Within EM, we prefer selective markets, such as India, which benefit from domestically driven economies and structural long-term growth stories. We also like Taiwan for its exposure to the technology sector, as it is a key supplier of semiconductors for the secular growth trend of AI capex rollout.
- Neutral on commodity-linked equities: We continue to believe that commodity-linked equities will keep providing ample diversification against inflation in the longer term. The fundamentals of the sector remain compelling due to both cyclical and secular factors.
Defensive assets
Defensive assets have been robust in 2025, with the Bloomberg Global Aggregate Bond Index returning approximately 4% in USD terms to the end of June. Carry is returning to the market, and with economic conditions holding stronger than many forecasters expected, the focus is on achieving stable income. The market remains convinced that the Fed will ease rates, with expectations of the Fed funds rate falling to 3.50% over the next 12 months. A contributing factor for such expectations is Trump’s insistence that Fed Chair Jerome Powell has not eased rates fast enough, with the speculation that a more dovish governor will replace Powell in 2026 when his term ends. Regardless of the actions taken by Trump, financial conditions continue to ease globally and this should support economic growth. Within the portfolios, we continue to use spread products to generate yield, and easing financial conditions could support this strategy over the coming six months. This month’s Balancing Act looks at high yield spreads, making the case that once adjusting for duration, spreads are not as tight as many believe.
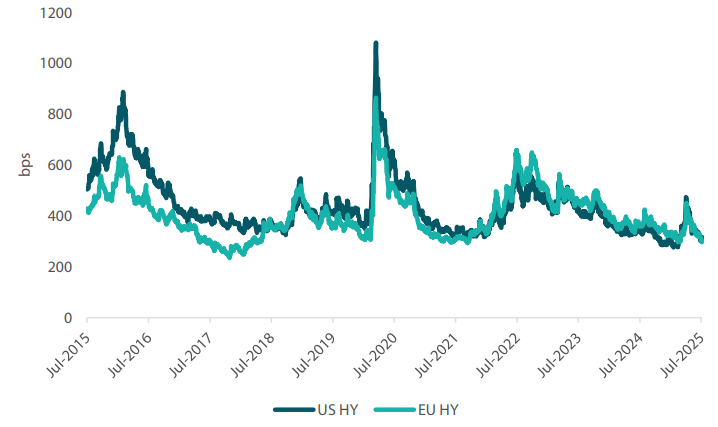
High yield—optically tight
High yield stands out as an attractive asset class for multi-asset allocations, as it offers higher levels of return than traditional bonds while exhibiting much lower levels of volatility than equities. When making the allocation though, the question arises of when spreads become too tight and no longer warrant the allocation given the asset class comes with higher levels of default risk. As shown in Chart 4 below, high yield spreads are now approaching historically tight levels, suggesting that the allocation to the asset class should begin to be unwound. The US high yield segment is offering around +300 bps over government bonds, while European high yield sits slightly below +300 bps. From an allocation perspective, increasing your exposure when spreads are above 600 bps is the easiest way to time the cycle. This prompts the question as to why our portfolios are still inclined towards overweighting the asset class despite the tightening spreads.
Chart 4: High yield spreads-to-worst against government bonds
Source: Bloomberg, July 2025
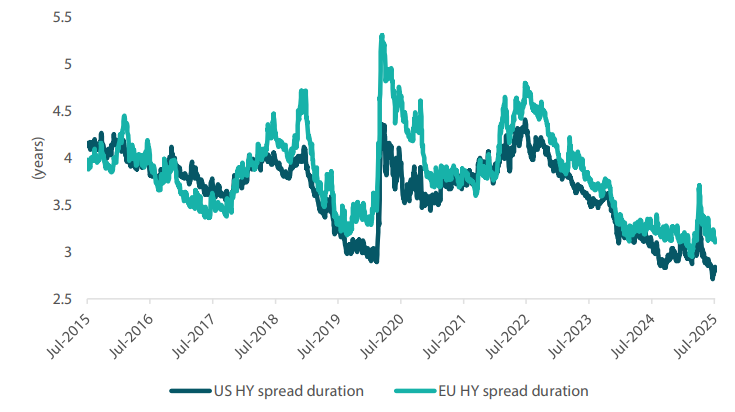
A factor often overlooked when observing credit indexes is the asset’s duration. While high yield spreads may appear to be compressing at the index level, this is also occurring along with a significant decrease in the asset class’s duration. For example, over the past 24 months, the spread duration of the US High Yield Index has dropped by over a year, from 4.4 years to just 2.7 years. As credit risk increases with time, this means that the extent of tightness in high yield spreads can also be affected by shifts in the asset’s duration underneath the index. In this instance, as high yield has shortened in duration by approximately 1.5 years, this could potentially results in a spread compression of 30–50 bps.
Chart 5: Durations of high yield indexes
Source: Bloomberg, July 2025
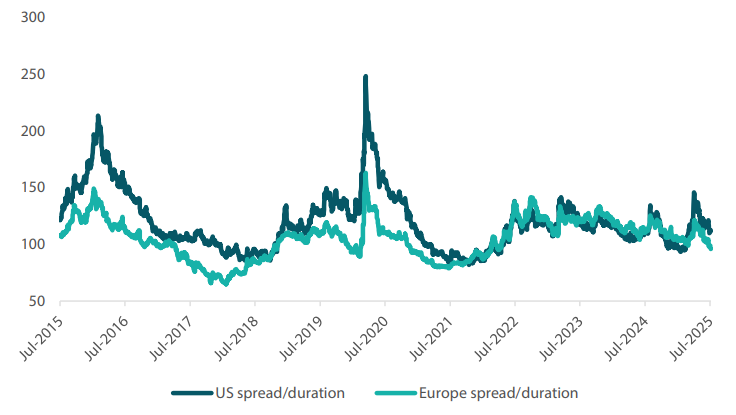
A better measure to assess spread exposures throughout market cycles is dividing a spread by duration. This gives a duration-adjusted measure of spread, which offers a more consistent perspective on the asset class. As Chart 6 below shows, while spreads have contracted, they are still above their prior cycle lows. For example, in the US market, a further contraction of roughly 50 bps would be necessary for the spread to reach its prior lows, which would bring the asset class well below the +300 level currently observed. In addition to this, as described above, we remain positive on the macro outlook and expect rate cuts to further support global growth. By putting these factors together, we continue to see the merits of holding overweight high yield allocations and expect the asset class to contribute strong levels of yield to our portfolios over the coming months.
Chart 6: US, Europe spreads divided by their durations
Source: Bloomberg, Nikko AM, July 2025
Conviction views on defensive assets
- Overweight high yield allocation: Credit spreads sold off during the April turmoil, which opened up short-dated opportunities. We believe that deals are going to be made on trade and that tax cuts will soon be on their way, which will be supportive of credit spreads in the shorter end. Additionally, high yield valuations remain somewhat attractive once accounting for the duration reduction of indexes.
- Gold reaches expensive valuations: After favouring gold as a hedge for the past 18 months, the metal’s price has now risen to levels that make valuations look expensive. Versus most asset classes, gold has outperformed and appears expensive against real assets such as housing and other commodities such as copper. While we like the idea of using gold for diversification, we listen to our process and have recently started to reduce our scores for what appears to be an expensive asset. The latest increase in the score of gold does not reflect any shift in this view, but rather a result of our recent update in our Strategic Asset Allocation.
- Overweight duration in selective countries: While we expect the trade deals to be less impactful than the market expectations, central banks do not have this luxury. With the risk of growth slowing, a number of central banks should continue easing, including the European Central Bank, Bank of England, Reserve Bank of Australia and the We like to use Australia as our overweight in duration as among the developed markets it has the largest link to China, and while trade deals could materialise for US allies, China will likely be singled out and face higher tariffs.
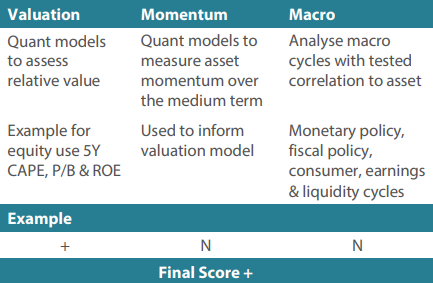
Process
In-house research to understand the key drivers of return:
Important information:
This document is prepared by Nikko Asset Management Co., Ltd. and/or its affiliates (Nikko AM) and is for distribution only under such circumstances as may be permitted by applicable laws. This document does not constitute personal investment advice or a personal recommendation and it does not consider in any way the objectives, financial situation or needs of any recipients. All recipients are recommended to consult with their independent tax, financial and legal advisers prior to any investment.
This document is for information purposes only and is not intended to be an offer, or a solicitation of an offer, to buy or sell any investments or participate in any trading strategy. Moreover, the information in this document will not affect Nikko AM’s investment strategy in any way. The information and opinions in this document have been derived from or reached from sources believed in good faith to be reliable but have not been independently verified. Nikko AM makes no guarantee, representation or warranty, express or implied, and accepts no responsibility or liability for the accuracy or completeness of this document. No reliance should be placed on any assumptions, forecasts, projections, estimates or prospects contained within this document. This document should not be regarded by recipients as a substitute for the exercise of their own judgment. Opinions stated in this document may change without notice.
In any investment, past performance is neither an indication nor guarantee of future performance and a loss of capital may occur. Estimates of future performance are based on assumptions that may not be realised. Investors should be able to withstand the loss of any principal investment. The mention of individual securities, sectors, regions or countries within this document does not imply a recommendation to buy or sell.
Nikko AM accepts no liability whatsoever for any loss or damage of any kind arising out of the use of all or any part of this document, provided that nothing herein excludes or restricts any liability of Nikko AM under applicable regulatory rules or requirements.
All information contained in this document is solely for the attention and use of the intended recipients. Any use beyond that intended by Nikko AM is strictly prohibited.
Japan: The information contained in this document pertaining specifically to the investment products is not directed at persons in Japan nor is it intended for distribution to persons in Japan. Registration Number: Director of the Kanto Local Finance Bureau (Financial Instruments firms) No. 368 Member Associations: The Investment Trusts Association, Japan/Japan Investment Advisers Association, Type II Financial Instruments Firms Association.
United Kingdom: This document is communicated by Nikko Asset Management Europe Ltd, which is authorised and regulated in the United Kingdom by the Financial Conduct Authority (the FCA) (FRN 122084). This document constitutes a financial promotion for the purposes of the Financial Services and Markets Act 2000 (as amended) (FSMA) and the rules of the FCA in the United Kingdom, and is directed at professional clients as defined in the FCA Handbook of Rules and Guidance.
United States: This document may not be duplicated, quoted, discussed or otherwise shared without prior consent. An offering of any investments, securities or investment advisory services with respect to securities may only be made by receipt of relevant and complete offering documentation and agreements, as applicable. Any offering or distribution of a Fund in the United States may only be conducted via a licensed and registered broker-dealer or a duly qualified entity. Nikko Asset Management Americas, Inc. is a United States Registered Investment Adviser.
Singapore: This document is for information to institutional investors as defined in the Securities and Futures Act (Chapter 289), and intermediaries only. Nikko Asset Management Asia Limited (Co. Reg. No. 198202562H) is regulated by the Monetary Authority of Singapore.
Hong Kong: This document is for information to professional investors as defined in the Securities and Futures Ordinance, and intermediaries only. The contents of this document have not been reviewed by the Securities and Futures Commission or any regulatory authority in Hong Kong. Nikko Asset Management Hong Kong Limited is a licensed corporation in Hong Kong.
New Zealand: This document is issued in New Zealand by Nikko Asset Management New Zealand Limited (Company No. 606057, FSP22562). It is for the use of wholesale clients, researchers, licensed financial advisers and their authorised representatives only.
List of Additional Disclaimers for use in the following countries
Kingdom of Bahrain: The document has not been approved by the Central Bank of Bahrain which takes no responsibility for its contents. No offer to the public to purchase the Strategy will be made in the Kingdom of Bahrain and this document is intended to be read by the addressee only and must not be passed to, issued to, or shown to the public generally.
Kuwait: This document is not for general circulation to the public in Kuwait. The Strategy has not been licensed for offering in Kuwait by the Kuwaiti Capital Markets Authority or any other relevant Kuwaiti government agency. The offering of the Strategy in Kuwait on the basis a private placement or public offering is, therefore, restricted in accordance with Decree Law No. 7 of 2010 and the bylaws thereto (as amended). No private or public offering of the Strategy is being made in Kuwait, and no agreement relating to the sale of the Strategy will be concluded in Kuwait. No marketing or solicitation or inducement activities are being used to offer or market the Strategy in Kuwait.
Kingdom of Saudi Arabia: This document is communicated by Nikko Asset Management Europe Ltd (Nikko AME), which is authorised and regulated by the Financial Services and Markets Act 2000 (as amended) (FSMA) and the rules of the Financial Conduct Authority (the FCA) in the United Kingdom (the FCA Rules). This document should not be reproduced, redistributed, or sent directly or indirectly to any other party or published in full or in part for any purpose whatsoever without a prior written permission from Nikko AME.
This document does not constitute investment advice or a personal recommendation and does not consider in any way the suitability or appropriateness of the subject matter for the individual circumstances of any recipient. In providing a person with this document, Nikko AME is not treating that person as a client for the purposes of the FCA Rules other than those relating to financial promotion and that person will not therefore benefit from any protections that would be available to such clients.
Nikko AME and its associates and/or its or their officers, directors or employees may have or have had positions or material interests, may at any time make purchases and/or sales as principal or agent, may provide or have provided corporate finance services to issuers or may provide or have provided significant advice or investment services in any investments referred to in this document or in related investments. Relevant confidential information, if any, known within any company in the Nikko AM group or Sumitomo Mitsui Trust Holdings group and not available to Nikko AME because of regulations or internal procedure is not reflected in this document. The investments mentioned in this document may not be eligible for sale in some states or countries, and they may not be suitable for all types of investors.
Oman: The information contained in this document nether constitutes a public offer of securities in the Sultanate of Oman as contemplated by the Commercial companies law of Oman (Royal decree 4/74) or the Capital Markets Law of Oman (Royal Decree80/98, nor does it constitute an offer to sell, or the solicitation of any offer to buy non-Omani securities in the Sultanate of Oman as contemplated by Article 139 of the Executive Regulations to the Capital Market law (issued by Decision No. 1/2009). This document is not intended to lead to the conclusion of any contract of whatsoever nature within the territory of the Sultanate of Oman.
Qatar (excluding QFC): The Strategies are only being offered to a limited number of investors who are willing and able to conduct an independent investigation of the risks involved in an investment in such Strategies. The document does not constitute an offer to the public and should not be reproduced, redistributed, or sent directly or indirectly to any other party or published in full or in part for any purpose whatsoever without a prior written permission from Nikko Asset Management Europe Ltd (Nikko AME). No transaction will be concluded in your jurisdiction and any inquiries regarding the Strategies should be made to Nikko AME.
United Arab Emirates (excluding DIFC): This document and the information contained herein, do not constitute, and is not intended to constitute, a public offer of securities in the United Arab Emirates and accordingly should not be construed as such. The Strategy is only being offered to a limited number of investors in the UAE who are (a) willing and able to conduct an independent investigation of the risks involved in an investment in such Strategy, and (b) upon their specific request.
The Strategy has not been approved by or licensed or registered with the UAE Central Bank, the Securities and Commodities Authority or any other relevant licensing authorities or governmental agencies in the UAE. This document is for the use of the named addressee only and should not be given or shown to any other person (other than employees, agents or consultants in connection with the addressee's consideration thereof).
No transaction will be concluded in the UAE and any inquiries regarding the Strategy should be made to Nikko Asset Management Europe Ltd.
Republic of Korea: This document is being provided for general information purposes only, and shall not, and under no circumstances is, to be construed as, an offering of financial investment products or services. Nikko AM is not making any representation with respect to the eligibility of any person to acquire any financial investment product or service. The offering and sale of any financial investment product is subject to the applicable regulations of the Republic of Korea. Any interests in a fund or collective investment scheme shall be sold after such fund is registered under the private placement registration regime in accordance with the applicable regulations of the Republic of Korea, and the offering of such registered fund shall be conducted only through a locally licensed distributor.
Canada: The information provided herein does not constitute any form of financial opinion or investment advice on the part of Nikko AM and it should not be relied on as such. It does not constitute a prospectus, offering memorandum or private placement memorandum in Canada, and may not be used in making any investment decision. It should not be considered a solicitation to buy or an offer to sell a security in Canada. This information is provided for informational and educational use only.
|
By the Multi-Asset Team
31 July 2025
|
Snapshot
The MSCI All Country World Index climbed 4.4% in US dollar (USD) terms over the month, as easing geopolitical risks, hopes that the US will secure trade deals ahead of the 9 July tariff deadline and optimism that the US Federal Reserve (Fed) could reduce interest rates in the coming months lifted sentiment. The US and China also finalised a trade framework, and the White House stated that it had imminent plans to reach agreements with several major trading partners. Developments in the Middle East had a minimal impact on markets as investors viewed the ongoing Israel-Iran conflict as likely short-lived. Israel established air superiority within a day, neutralising Iran’s much-touted projectile response. Subsequently, Israel was free to target locations within Iran. The US soon joined the conflict, targeting Iranian nuclear sites with Massive Ordnance Penetrator strikes. A ceasefire between Israel and Iran was reached soon after. Technology stocks (which did well again in June) have grabbed the limelight recently, but we find that there is another sector that deserves a closer look. Hint: this section is not typically considered “sexy”.
Within fixed income, the US Treasury (UST) yield curve shifted lower in June, with front-end yields outperforming. Yields initially rose following a stronger-than-expected US jobs report, with non-farm payrolls increasing by 139,000. The European Central Bank (ECB) delivered a widely-anticipated rate cut in early June but signalled a possible pause—if not an end—to its easing cycle. Escalating tensions between Israel and Iran did fuel risk-off sentiment and a flight to safety. The Fed held rates steady, as expected, and maintained a cautious, data-dependent stance. During his semi-annual testimony, Fed Chairman Jerome Powell pushed back against expectations for a July cut. However, yields continued to decline, driven by dovish remarks from Fed Governors Christopher Waller and Michelle Bowman in support of a July rate cut, falling oil prices following the Iran-Israel truce and downward GDP revisions reflecting softer consumer spending. By the end of June, the benchmark 2-year and 10-year UST yields settled at 3.72% and 4.23%, respectively, 18 basis points (bps) and 17 bps lower compared to end-May.
Outside of general equity and fixed income markets, gold prices rose 0.4% in June amid geopolitical and trade tensions, as well as increased optimism that the Fed is preparing to resume monetary easing. A weaker dollar also lent support to gold prices. The US currency saw its worst start to a year in more than half a century, with the dollar index (DXY) down nearly 11% for the first half of the year. West Texas Intermediate crude oil prices jumped 7.1%, but not without sharp price swings over the month. Prices initially surged after the flare-up of tensions in the Middle East and US airstrikes on Iranian nuclear sites, but they retreated after a ceasefire between Iran and Israel eased fears of global oil supply disruptions. Real estate, as measured by the FTSE NAREIT Global Real Estate Index, edged up 0.4%.
Cross-asset1
For the month of June, we maintained our overweight to growth assets while reducing our defensives marginally. We remain confident that growth assets will continue to do well through the rest of the year, despite the prevailing uncertainties surrounding import tariffs. Market consensus for corporate earnings in the coming quarter has been revised lower since the last reporting season, setting a low bar for companies to surpass. However, we are mindful of any corporate guidance regarding the delayed impact of tariffs that might affect our investment view. Our overweight stance is currently based on our view that news flow will become more positive, with a number of trade deals likely to be announced over the coming weeks. The recent tax bill passage is also positive for consumption and corporate profits and should stimulate further investments in the US. Outside of the US, we still view the rate-cutting cycle favourably, and this could help offset some of the slower economic growth that we are seeing. For defensive assets, we downgraded our score again in June, bringing the allocation back to neutral. US economic data continued to outperform market expectations, and this could potentially lead to upward pressure on interest rates in the near term.
Within growth assets, we maintained our overweight in developed market (DM) equities and emerging market (EM) equities. Within DM, we kept our overweight in the US on the back of better visibility on earnings growth and likely Fed cuts in the second half of the year. As a result we maintained our underweight on the UK and Australia. We kept our neutral position in Japan on expectations of the yen weakening on the Bank of Japan (BOJ)’s shift to a less hawkish tone. The longer-term structural story of improving corporate governance and earnings growth momentum in Japan remains intact. Likewise, we maintained our neutral position on Europe with the expectations that the region’s corporate earnings should turn positive in the latter half of the year with the European Central Bank (ECB) cutting rates more aggressively than the Fed. This should help to reflate the region and kickstart its economy. We continue to like Singapore for its attractive dividend yields and resilient economy. Within EM, we continue to favour selective countries—like India—which are expected to benefit from domestically-driven economies and structural long-term growth stories. Likewise, we retained our overweight position in Taiwan, which is a beneficiary of the current global tech upcycle. We maintained our neutral position in commodity-linked equities given their attractive valuation and for diversification purposes. The asset class continues to generate strong free cash flow and has good dividend yields. We maintained our underweights in REITs and infrastructure, as we see better risk rewards in other asset classes.
For defensives, we upgraded our score to gold and decreased our scores on DM sovereign bonds and investment grade (IG) credit. The increase in the score of gold is not due to a shift in our view; rather, it reflects a recent update to our Strategic Asset Allocation. We dropped our allocation to gold substantially, and our portfolios no longer hold underweights as a result. On the DM sovereigns side, we continue to see strong data coming from the US, and the market’s risk-on sentiment is pushing out Fed rate cut expectations. Hence, while the carry in the bond market is now much better than it was six to 12 months ago, the direction of yields remains volatile, shifting on a monthly basis. Within IG credit, we downgraded our score marginally to reflect the compression in spreads, with the widening from the “Liberation Day” tariffs now completely reversed. We expect credit to perform well over the short term due to strong economic conditions; however, given how tight IG spreads have become, there is less ability for spread compression to occur. In other segments of the market, we remain overweight in high yield, as spreads are not as tight as they appear at a first glance (as discussed in more detail below). For EM sovereigns, we retain a slight underweight but are approaching a neutral position. EM typically benefits from dollar weakness, and we seek to slowly allocate back into these exposures.
1 The Multi Asset team’s cross-asset views are expressed at three different levels: (1) growth versus defensive, (2) cross asset within growth and defensive assets, and (3) relative asset views within each asset class. These levels describe our research and intuition that asset classes behave similarly or disparately in predictable ways, such that cross-asset scoring makes sense and ultimately leads to more deliberate and robust portfolio construction.
Asset Class Hierarchy (Team View2)
2The asset classes or sectors mentioned herein are a reflection of the portfolio manager’s current view of the investment strategies taken on behalf of the portfolio managed. The research framework is divided into 3 levels of analysis. The scores presented reflect the team’s view of each asset relative to others in its asset class. Scores within each asset class will average to neutral, with the exception of Commodity. These comments should not be constituted as an investment research or recommendation advice. Any prediction, projection or forecast on sectors, the economy and/or the market trends is not necessarily indicative of their future state or likely performances.
Research views
Growth assets
Growth assets remain appealing, as we believe that global economic growth will stay resilient despite the ongoing uncertainties due to the status of the US import tariffs, which are currently under review by the US Supreme Court. Market sentiment is gradually improving as trade deals are being discussed, with agreements potentially reached in the coming weeks. While there have been indications of softening US economic data, the economy has not collapsed as initially feared. Inflation remains benign globally, providing room for central banks to implement supportive measures to bolster economic growth. Corporate profits in the US have been resilient so far, while earnings outside of the US have been softer than expected as the global economy slows.
Overall, earnings growth remains on an upward trajectory, providing support for growth assets. However, uncertainties persist due to ongoing trade tariffs discussions and legal challenges to the Trump administration. Clarity may emerge over the next few months as these uncertainties are resolved. In the short term, we note that the passing of the tax bill is positive and should help to boost consumption and corporate profits, and any Fed rate cuts in the second half of the year should also be supportive of continued economic activities in the US.
Investing beyond the technology sector
Much has been written and debated on the technology sector, with a particular focus on its secular earnings growth and the recent scrutiny over the returns generated from investments in artificial intelligence (AI) and data centres by the major tech companies. Corporate earnings in the sector had been stellar since the Global Financial Crisis (GFC) and have significantly contributed to the earnings growth of the S&P Index over the past decade. The sector has returned an annualised performance of 19% in the past five years.
Amidst all the hype surrounding the technology sector, there are other sectors that may have been overlooked but offer promising opportunities. When we compare the various sectors of the MSCI AC World Index over the past five years, the financials sector emerges as the next best performer, delivering a surprising annualised return of 16% (see Chart 1). Financials, often seen as a traditional value sector, may not have the same appeal of growth sectors such as communications or technology. Yet it has outperformed many other sectors over the period.
Chart 1: MSCI AC World Financials performance against other sectors
Source: Bloomberg, July 2025
Upon assessing the performance of the financials sector over the period, we found that one of reasons for its outperformance relative to the other sectors is its value-oriented nature. In 2022, the sector experienced smaller drawdowns compared to other growth sectors such as technology and communications. This can be attributed to the financials sector’s less demanding valuations. Growth sectors tend to command higher valuations and are punished harder in a risk-off environment. Growth sectors are also more sensitive to changes in the interest rate environment due to their back-loaded cashflows, resulting in lower intrinsic values when interest rates rise.
Contrary to its growth sector peers, financials usually perform better in a higher interest rate environment. As interest rate rose on the back of inflation amid resilient economic activities during the period, banks were able to increase their asset yields. This was achieved by increasing loan rates at a faster pace than deposit costs, resulting in the initial expansion of net interest margins (NIM). Consequently, the sector has seen its earnings improve. However, as depositors demand higher returns and deposit costs start to rise, NIMs will contract over time. By examining the top three regional US banks in Chart 2 below, we observe how their NIMs increased as the Fed raised interest rates through 2016–2019 and 2022–2024. As we have been in a “higher for longer” environment since 2022, banks have been able to enjoy strong earnings growth through this period.
Chart 2: Higher interest rates have lifted the NIMs of top three US regional banks
Source: Bloomberg, July 2025
The financials sector is also one of the key beneficiaries of US President Donald Trump’s victory, driven by expectations of deregulation, corporate tax cuts and a rebound in capital markets activity. The sector has been actively redistributing capital to shareholders via dividends and buybacks (See Chart 3), representing about 40–60% of earnings. With Trump’s win, US regulators have loosened capital rules—particularly those concerning the supplementary leverage ratio— enabling banks to increase their capital return. This move is expected to be well-received by investors. With the economy holding up better than expected and capital returns increasing, we expect the sector to continue performing well in the near term.
Chart 3: US financials’ capital returns to shareholders poised to increase
Source: Bloomberg, July 2025
Conviction views on growth assets
- Maintain overweight exposure to US growth for now: We continue to like the US for its secular long-term earnings growth driven by technology and healthcare innovations. We are also positive on increasing energy demand from data centres with the significant AI capex outlay over the next few years. There remains potential for positive surprises in the market, such as responses from central banks and import tariffs relief.
- Overweight on Singapore: We still have an overweight position in Singapore due to its defensive attributes. Singapore offers high dividend yields and low beta. The market is also strong in terms of relative valuation metrics and are least likely to be targeted by Trump’s tariffs policies, given Singapore’s trade balance deficit position.
- Maintain our overweight exposure to EMs: Within EM, we prefer selective markets, such as India, which benefit from domestically driven economies and structural long-term growth stories. We also like Taiwan for its exposure to the technology sector, as it is a key supplier of semiconductors for the secular growth trend of AI capex rollout.
- Neutral on commodity-linked equities: We continue to believe that commodity-linked equities will keep providing ample diversification against inflation in the longer term. The fundamentals of the sector remain compelling due to both cyclical and secular factors.
Defensive assets
Defensive assets have been robust in 2025, with the Bloomberg Global Aggregate Bond Index returning approximately 4% in USD terms to the end of June. Carry is returning to the market, and with economic conditions holding stronger than many forecasters expected, the focus is on achieving stable income. The market remains convinced that the Fed will ease rates, with expectations of the Fed funds rate falling to 3.50% over the next 12 months. A contributing factor for such expectations is Trump’s insistence that Fed Chair Jerome Powell has not eased rates fast enough, with the speculation that a more dovish governor will replace Powell in 2026 when his term ends. Regardless of the actions taken by Trump, financial conditions continue to ease globally and this should support economic growth. Within the portfolios, we continue to use spread products to generate yield, and easing financial conditions could support this strategy over the coming six months. This month’s Balancing Act looks at high yield spreads, making the case that once adjusting for duration, spreads are not as tight as many believe.
High yield—optically tight
High yield stands out as an attractive asset class for multi-asset allocations, as it offers higher levels of return than traditional bonds while exhibiting much lower levels of volatility than equities. When making the allocation though, the question arises of when spreads become too tight and no longer warrant the allocation given the asset class comes with higher levels of default risk. As shown in Chart 4 below, high yield spreads are now approaching historically tight levels, suggesting that the allocation to the asset class should begin to be unwound. The US high yield segment is offering around +300 bps over government bonds, while European high yield sits slightly below +300 bps. From an allocation perspective, increasing your exposure when spreads are above 600 bps is the easiest way to time the cycle. This prompts the question as to why our portfolios are still inclined towards overweighting the asset class despite the tightening spreads.
Chart 4: High yield spreads-to-worst against government bonds
Source: Blomberg, July 2025
A factor often overlooked when observing credit indexes is the asset’s duration. While high yield spreads may appear to be compressing at the index level, this is also occurring along with a significant decrease in the asset class’s duration. For example, over the past 24 months, the spread duration of the US High Yield Index has dropped by over a year, from 4.4 years to just 2.7 years. As credit risk increases with time, this means that the extent of tightness in high yield spreads can also be affected by shifts in the asset’s duration underneath the index. In this instance, as high yield has shortened in duration by approximately 1.5 years, this could potentially results in a spread compression of 30–50 bps.
Chart 5: Durations of high yield indexes
Source: Bloomberg, July 2025
A better measure to assess spread exposures throughout market cycles is dividing a spread by duration. This gives a duration-adjusted measure of spread, which offers a more consistent perspective on the asset class. As Chart 6 below shows, while spreads have contracted, they are still above their prior cycle lows. For example, in the US market, a further contraction of roughly 50 bps would be necessary for the spread to reach its prior lows, which would bring the asset class well below the +300 level currently observed. In addition to this, as described above, we remain positive on the macro outlook and expect rate cuts to further support global growth. By putting these factors together, we continue to see the merits of holding overweight high yield allocations and expect the asset class to contribute strong levels of yield to our portfolios over the coming months.
Chart 6: US, Europe spreads divided by their durations
Source: Bloomberg, Nikko AM, July 2025
Conviction views on defensive assets
- Overweight high yield allocation: Credit spreads sold off during the April turmoil, which opened up short-dated opportunities. We believe that deals are going to be made on trade and that tax cuts will soon be on their way, which will be supportive of credit spreads in the shorter end. Additionally, high yield valuations remain somewhat attractive once accounting for the duration reduction of indexes.
- Gold reaches expensive valuations: After favouring gold as a hedge for the past 18 months, the metal’s price has now risen to levels that make valuations look expensive. Versus most asset classes, gold has outperformed and appears expensive against real assets such as housing and other commodities such as copper. While we like the idea of using gold for diversification, we listen to our process and have recently started to reduce our scores for what appears to be an expensive asset. The latest increase in the score of gold does not reflect any shift in this view, but rather a result of our recent update in our Strategic Asset Allocation.
- Overweight duration in selective countries: While we expect the trade deals to be less impactful than the market expectations, central banks do not have this luxury. With the risk of growth slowing, a number of central banks should continue easing, including the European Central Bank, Bank of England, Reserve Bank of Australia and the We like to use Australia as our overweight in duration as among the developed markets it has the largest link to China, and while trade deals could materialise for US allies, China will likely be singled out and face higher tariffs.
Process
In-house research to understand the key drivers of return:
